Tax Filer Demographics and Migration Reports
About the Reports
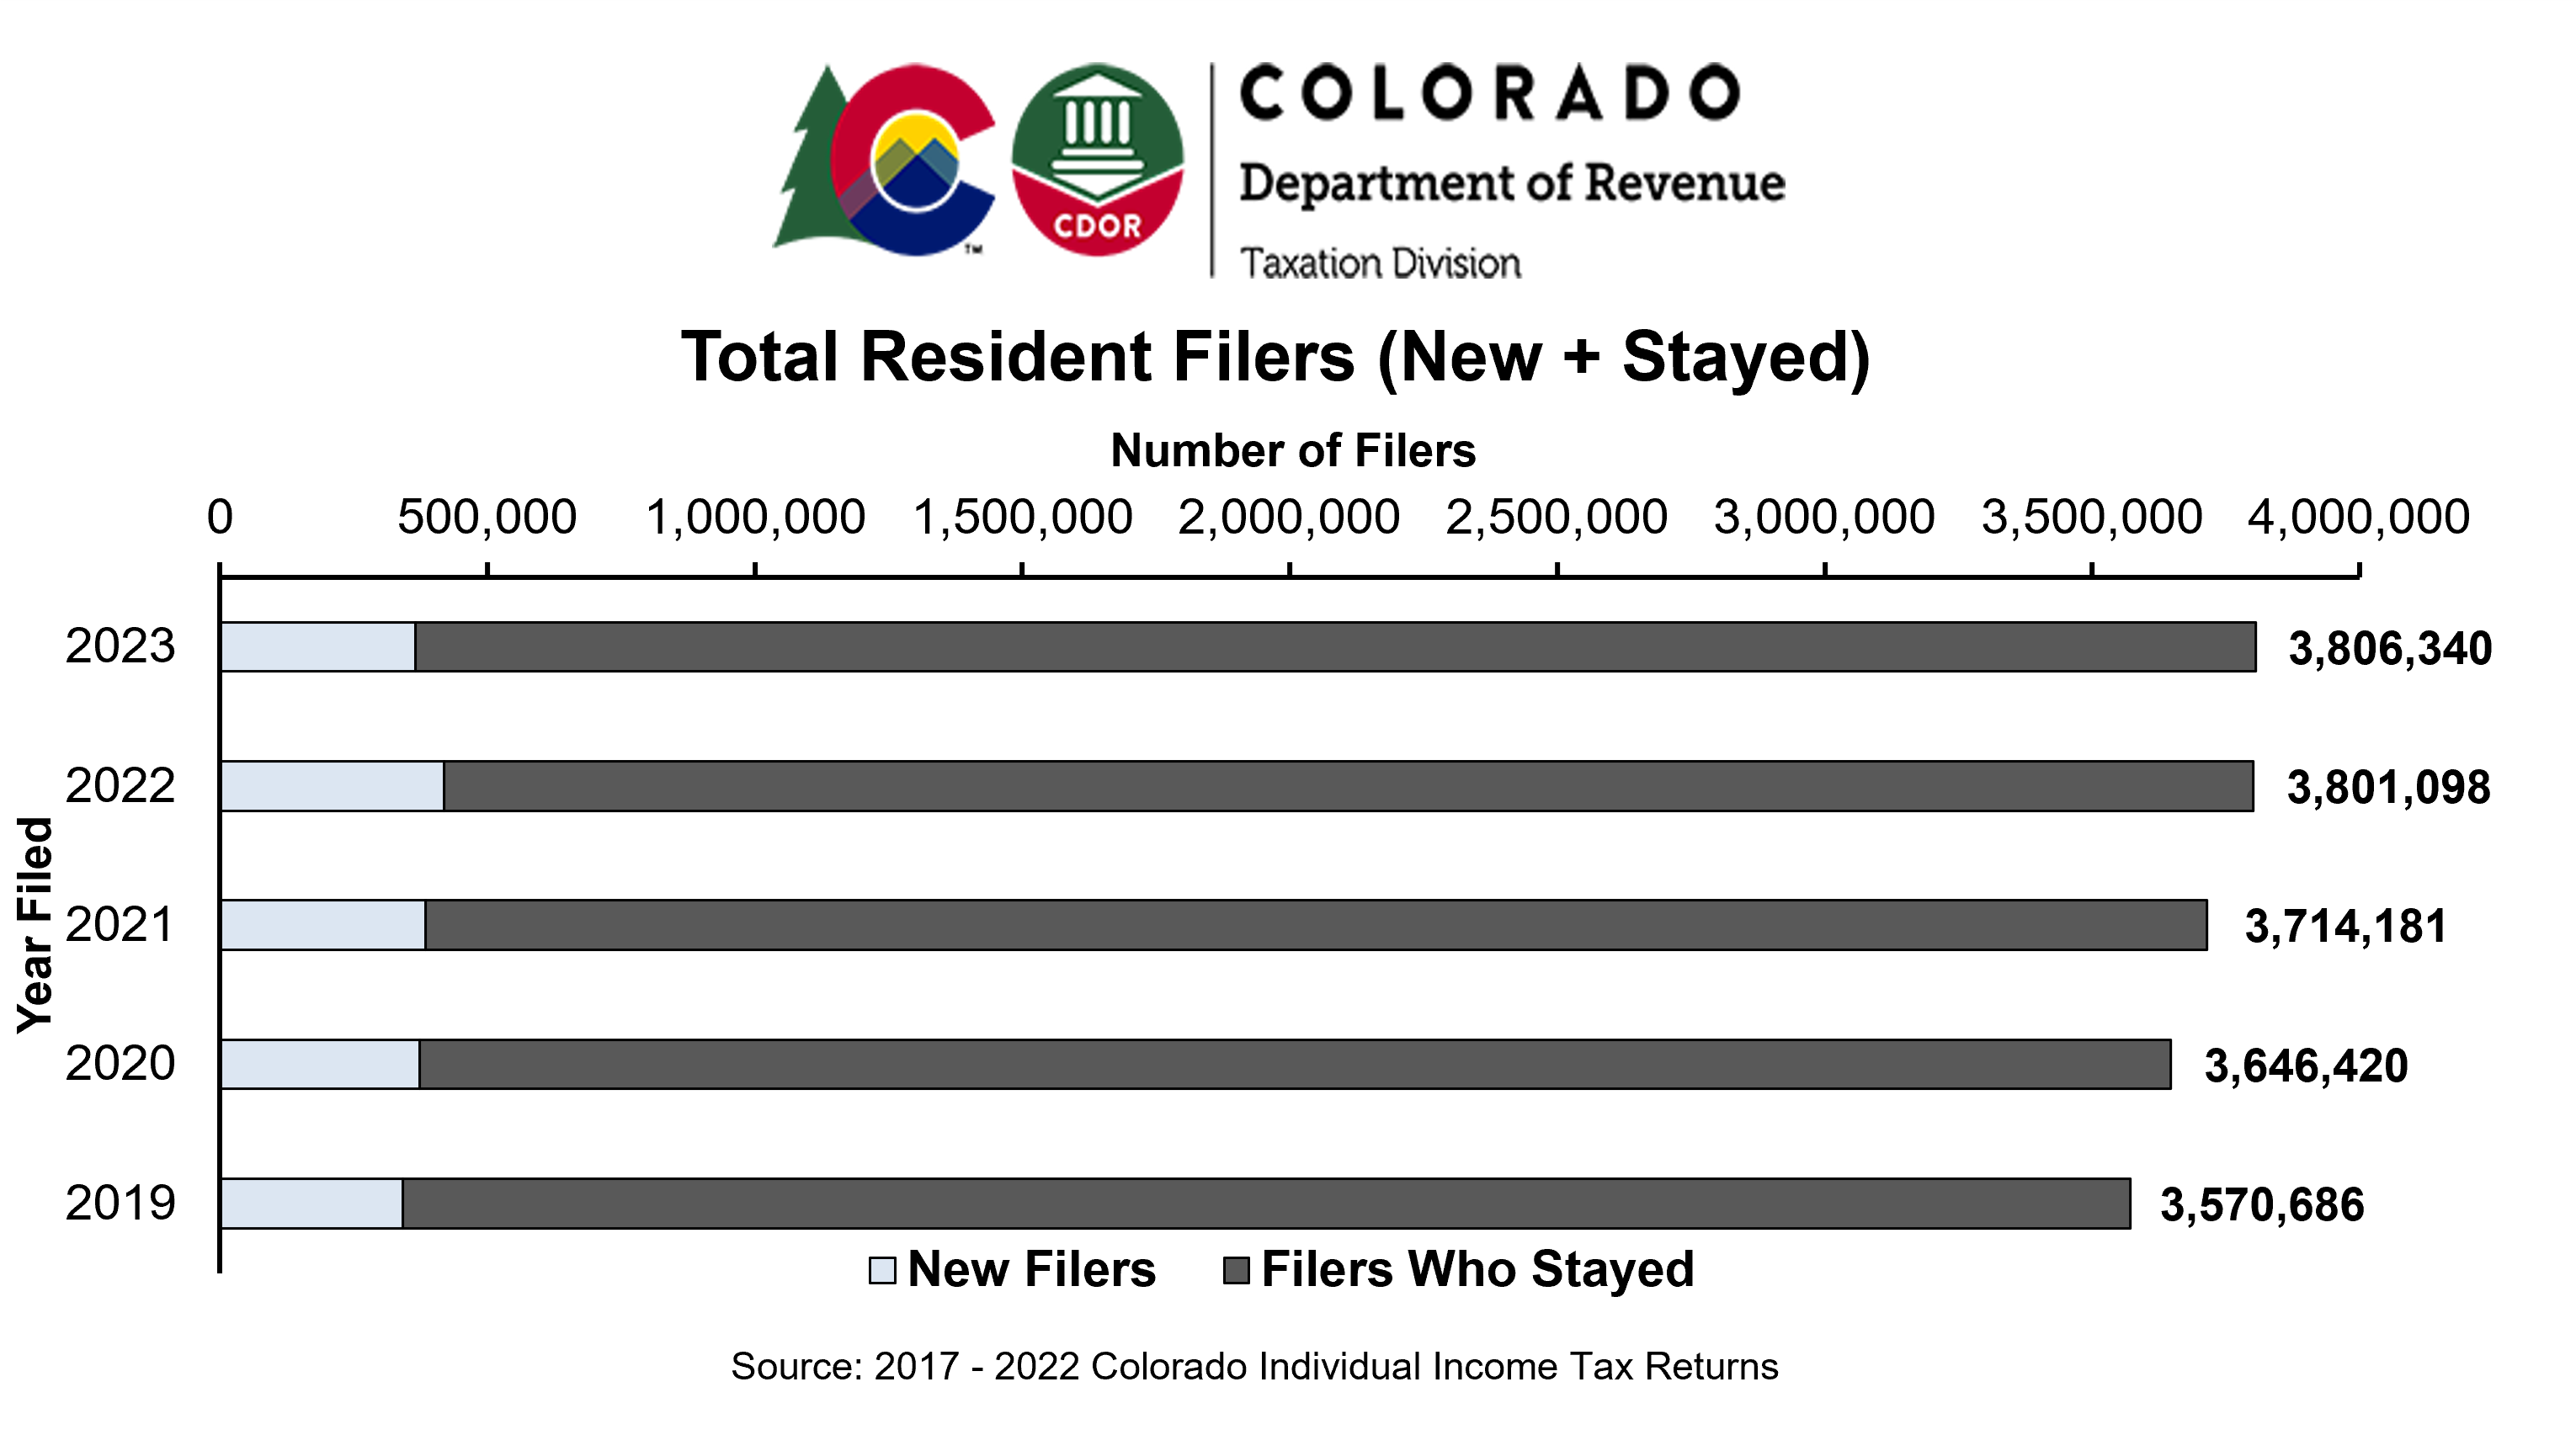
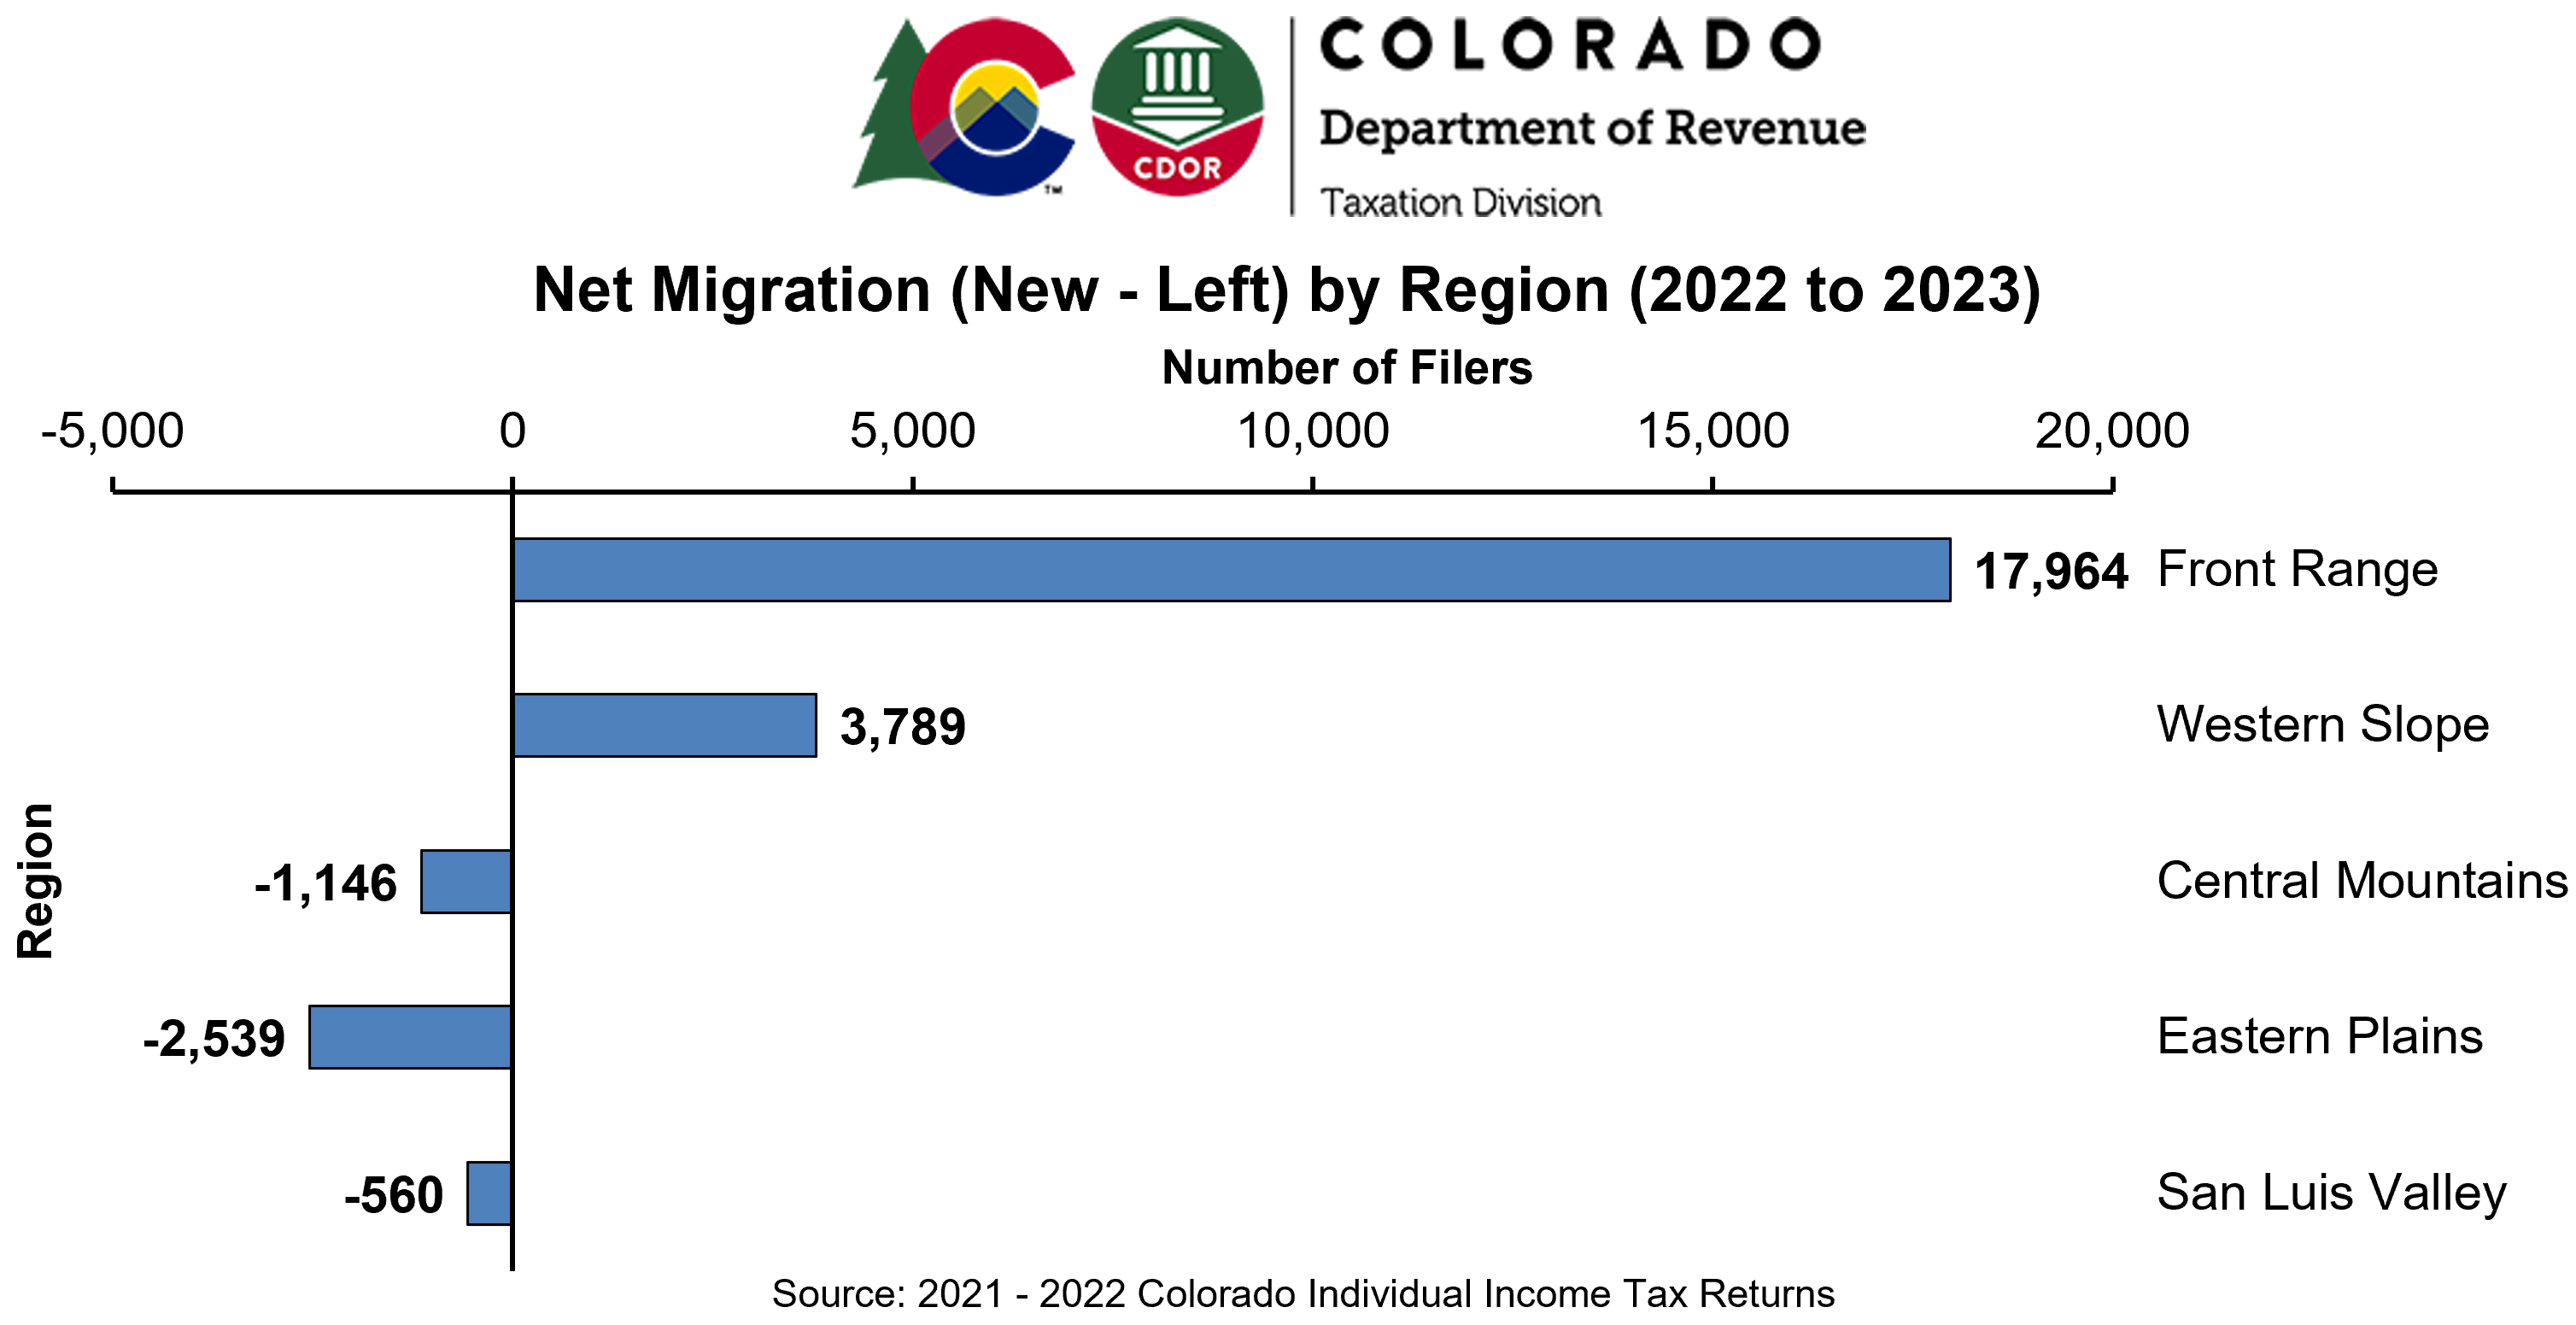
These reports summarize the demographics and migration of Colorado individual income tax filers. Data is summarized at the state, region, and county levels. The demographic data includes the average age, average federal adjusted gross income ("income"), and median income of the filers in each location. The migration data compares state income tax returns matched on taxpayer ID from two consecutive years to determine total resident filers, filers who stayed, new filers, filers who left, and net migration per location. Net migration is the number of new filers minus the number of filers who left.
Note that the numbers in these reports are not total populations, just the population of individual income tax filers. The reports do not include individuals that are not required to file a Colorado tax return such as dependents without income or individuals with income below the minimum required to file.
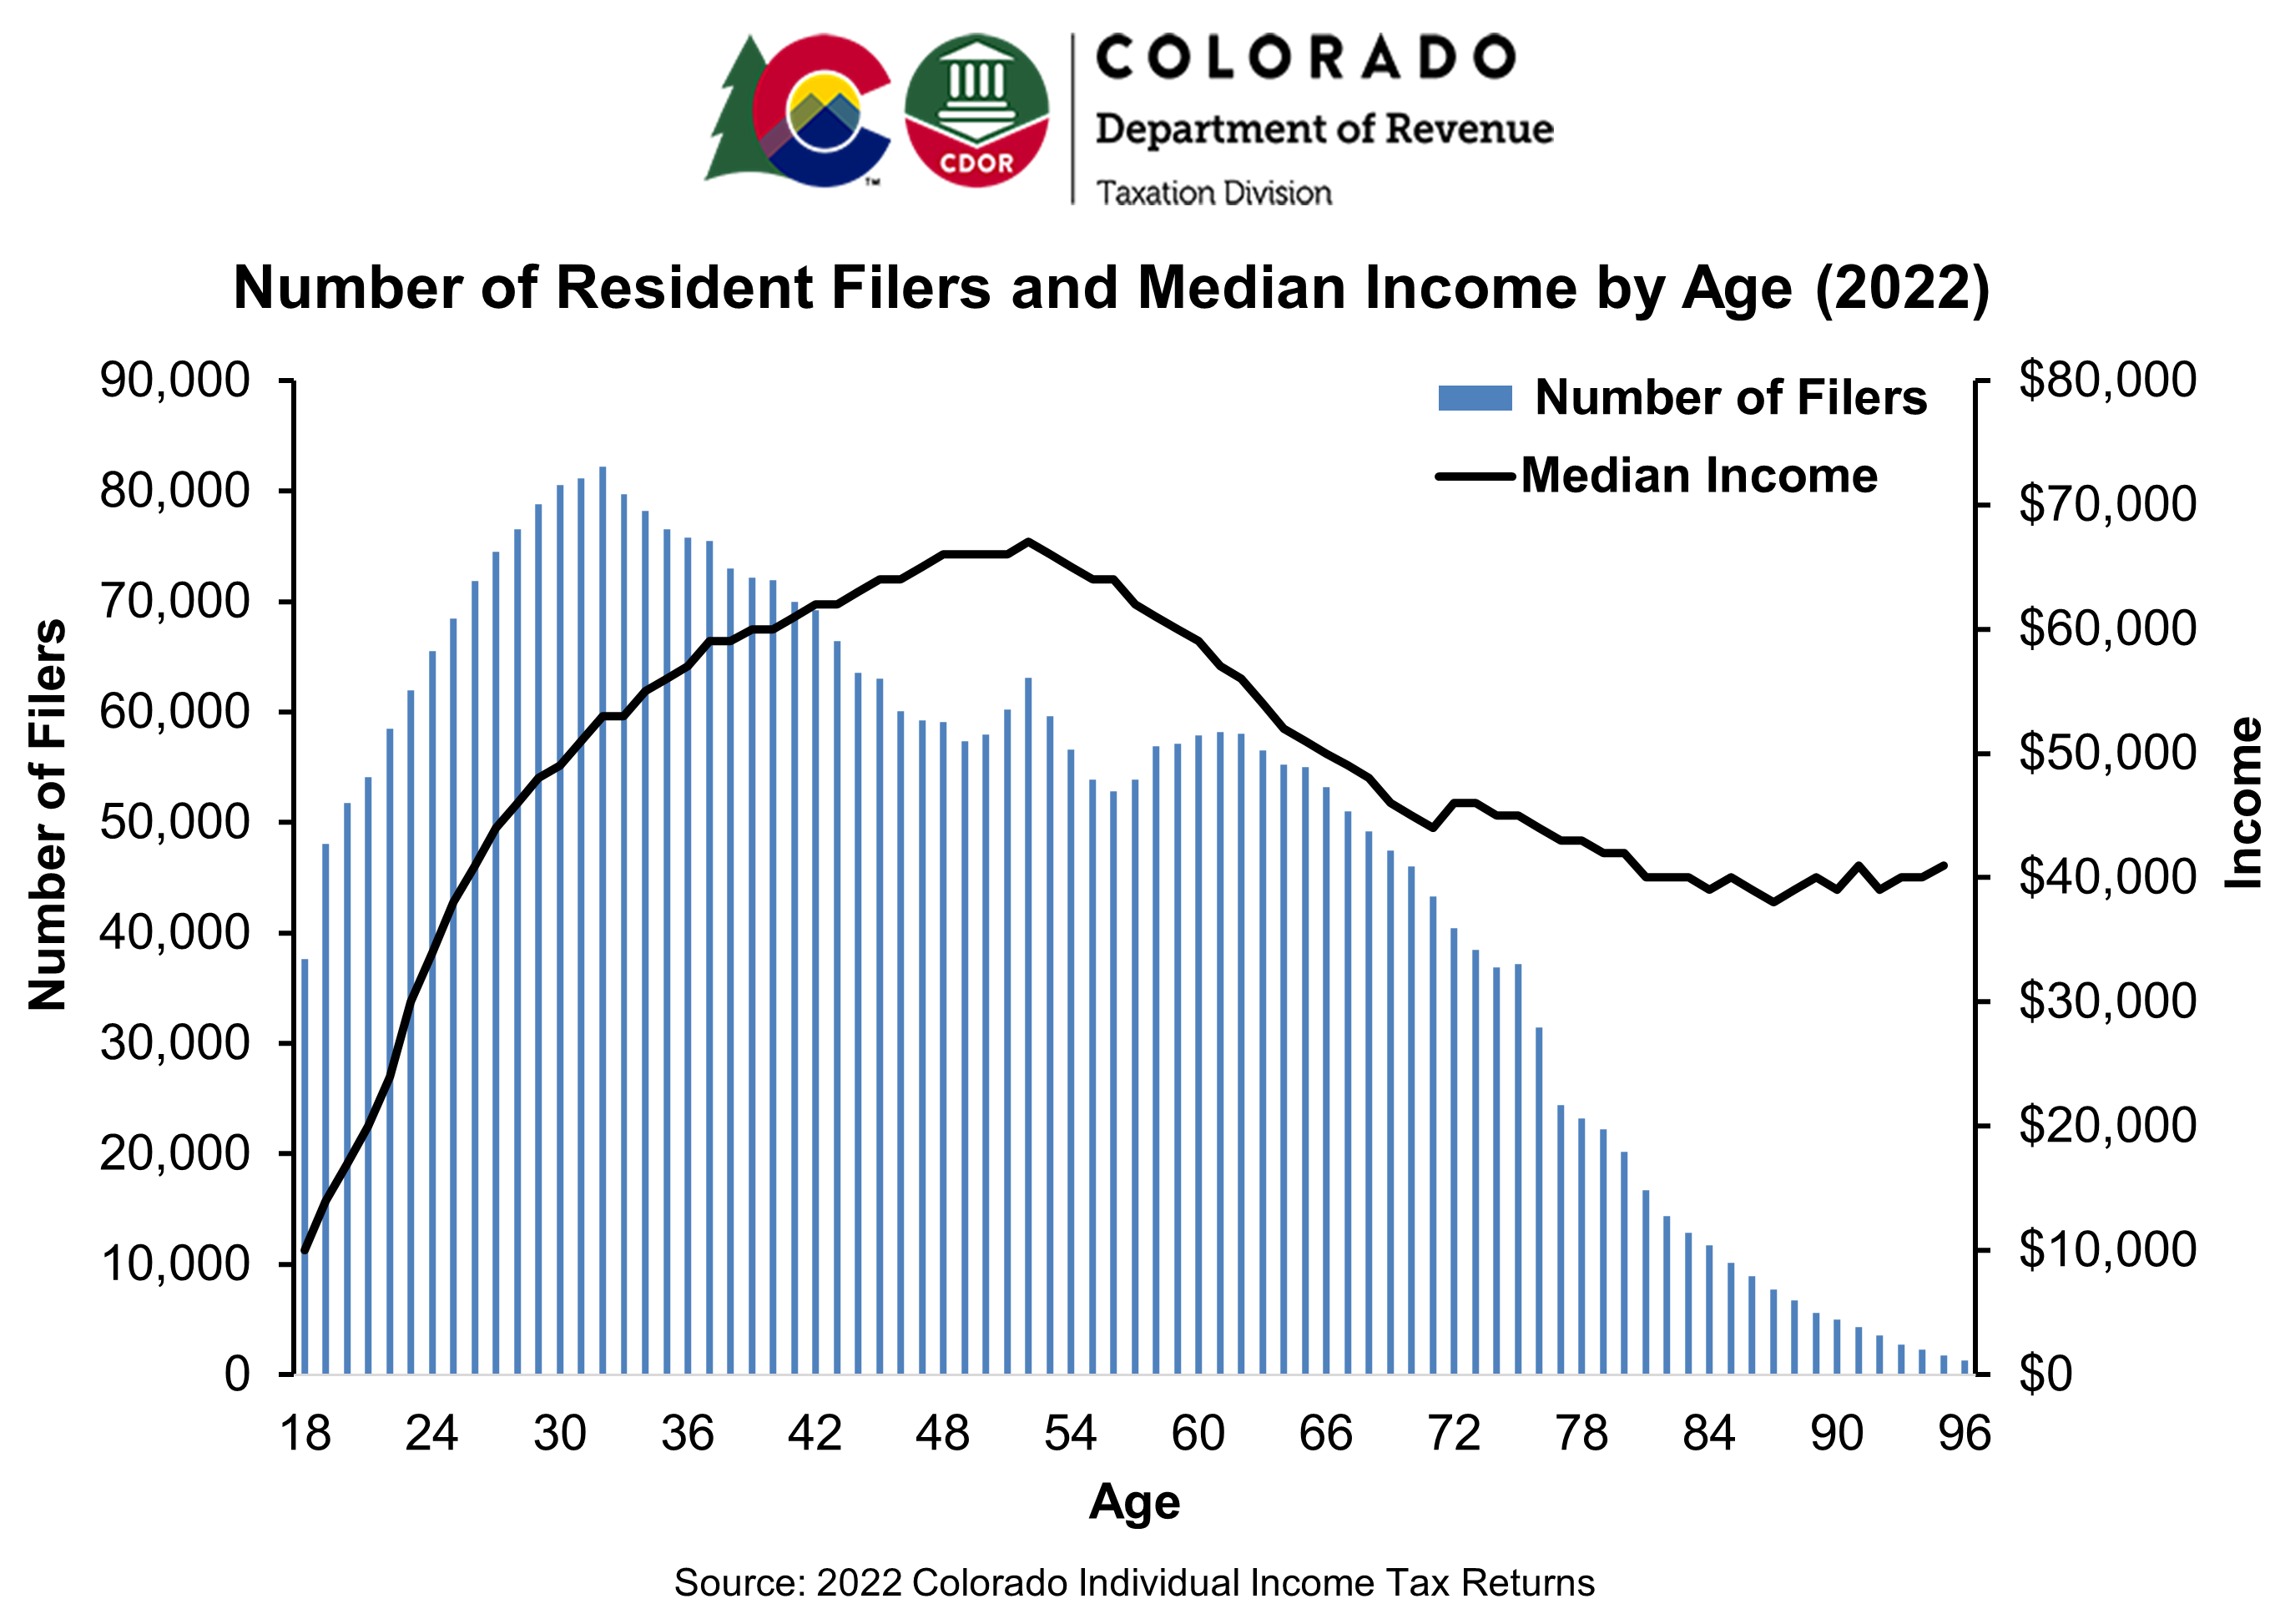
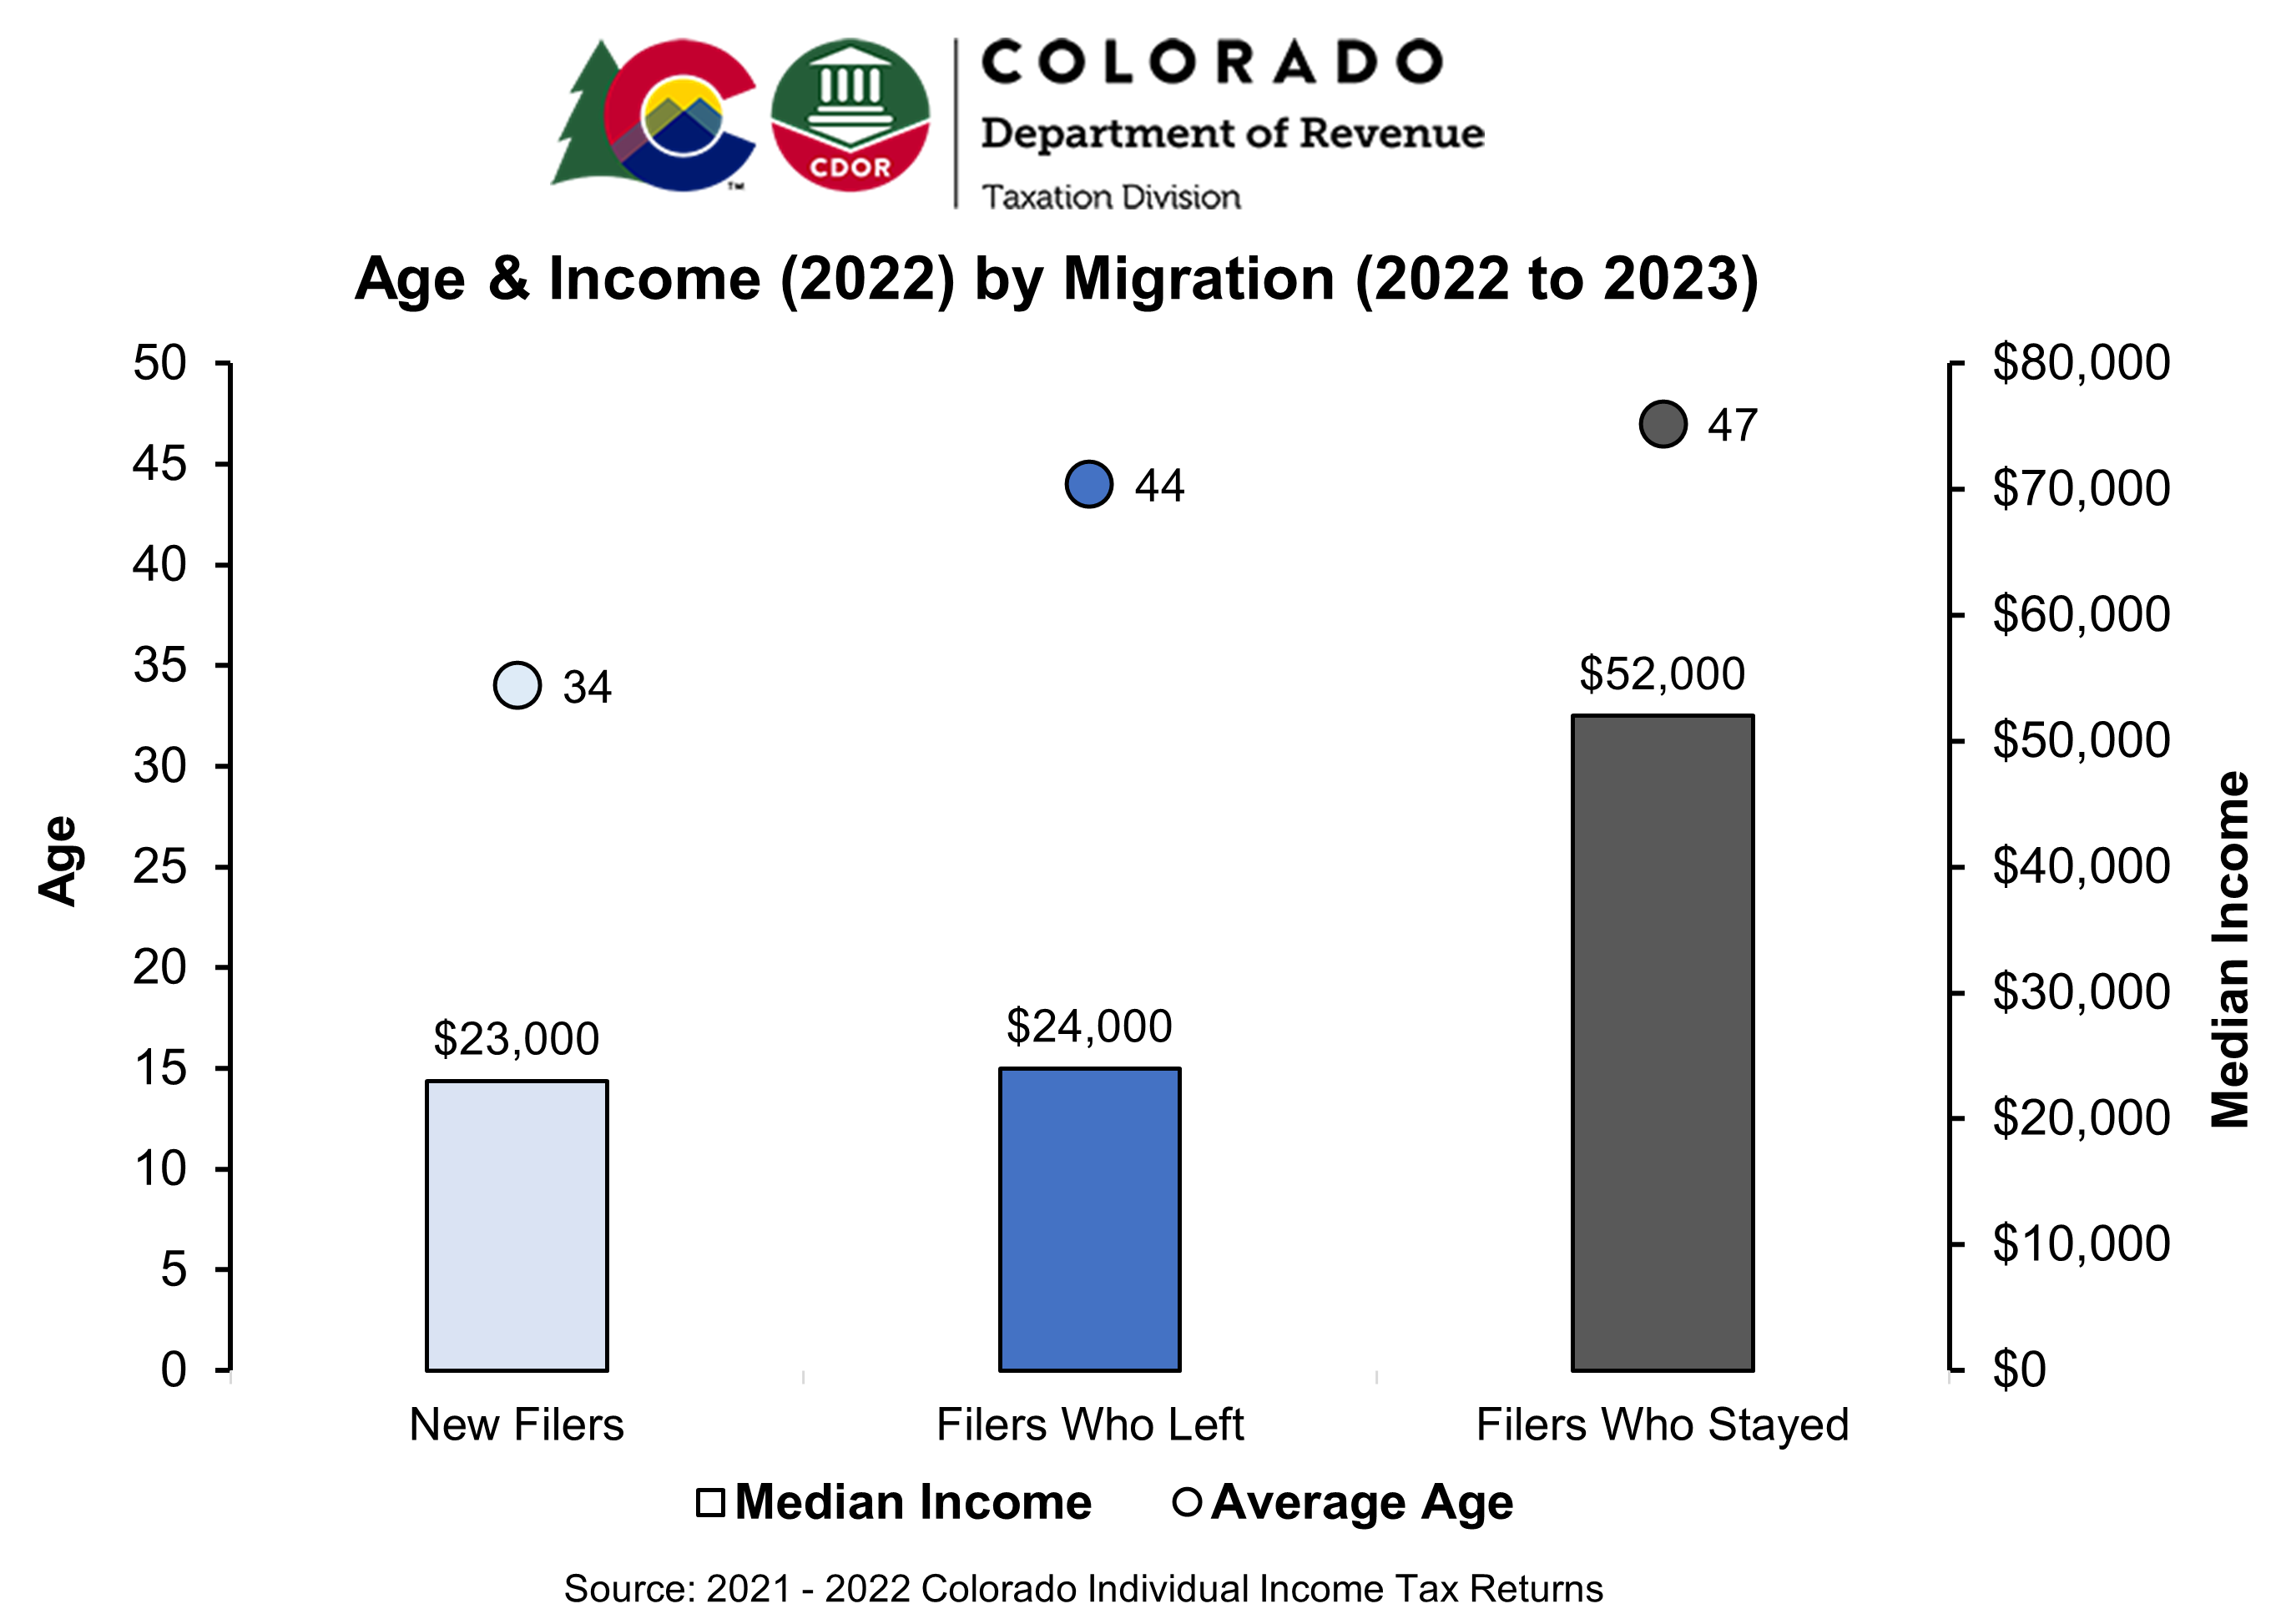
State
The state report summarizes the demographics and migration of Colorado residents at the state level. It also shows age and income for each migration group (filers who stayed, new filers, filers who left).
Region
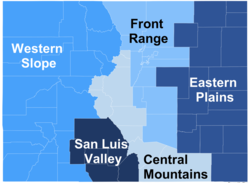
The region report summarizes the demographics and migration of Colorado residents at the region level. There are five Colorado regions: Central Mountains, Eastern Plains, Front Range, San Luis Valley, and Western Slope.
Region Demographics and Migration Report
County
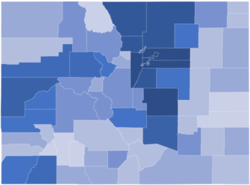
The county report summarizes the demographics and migration of Colorado residents at the county level. There are 64 Colorado counties.
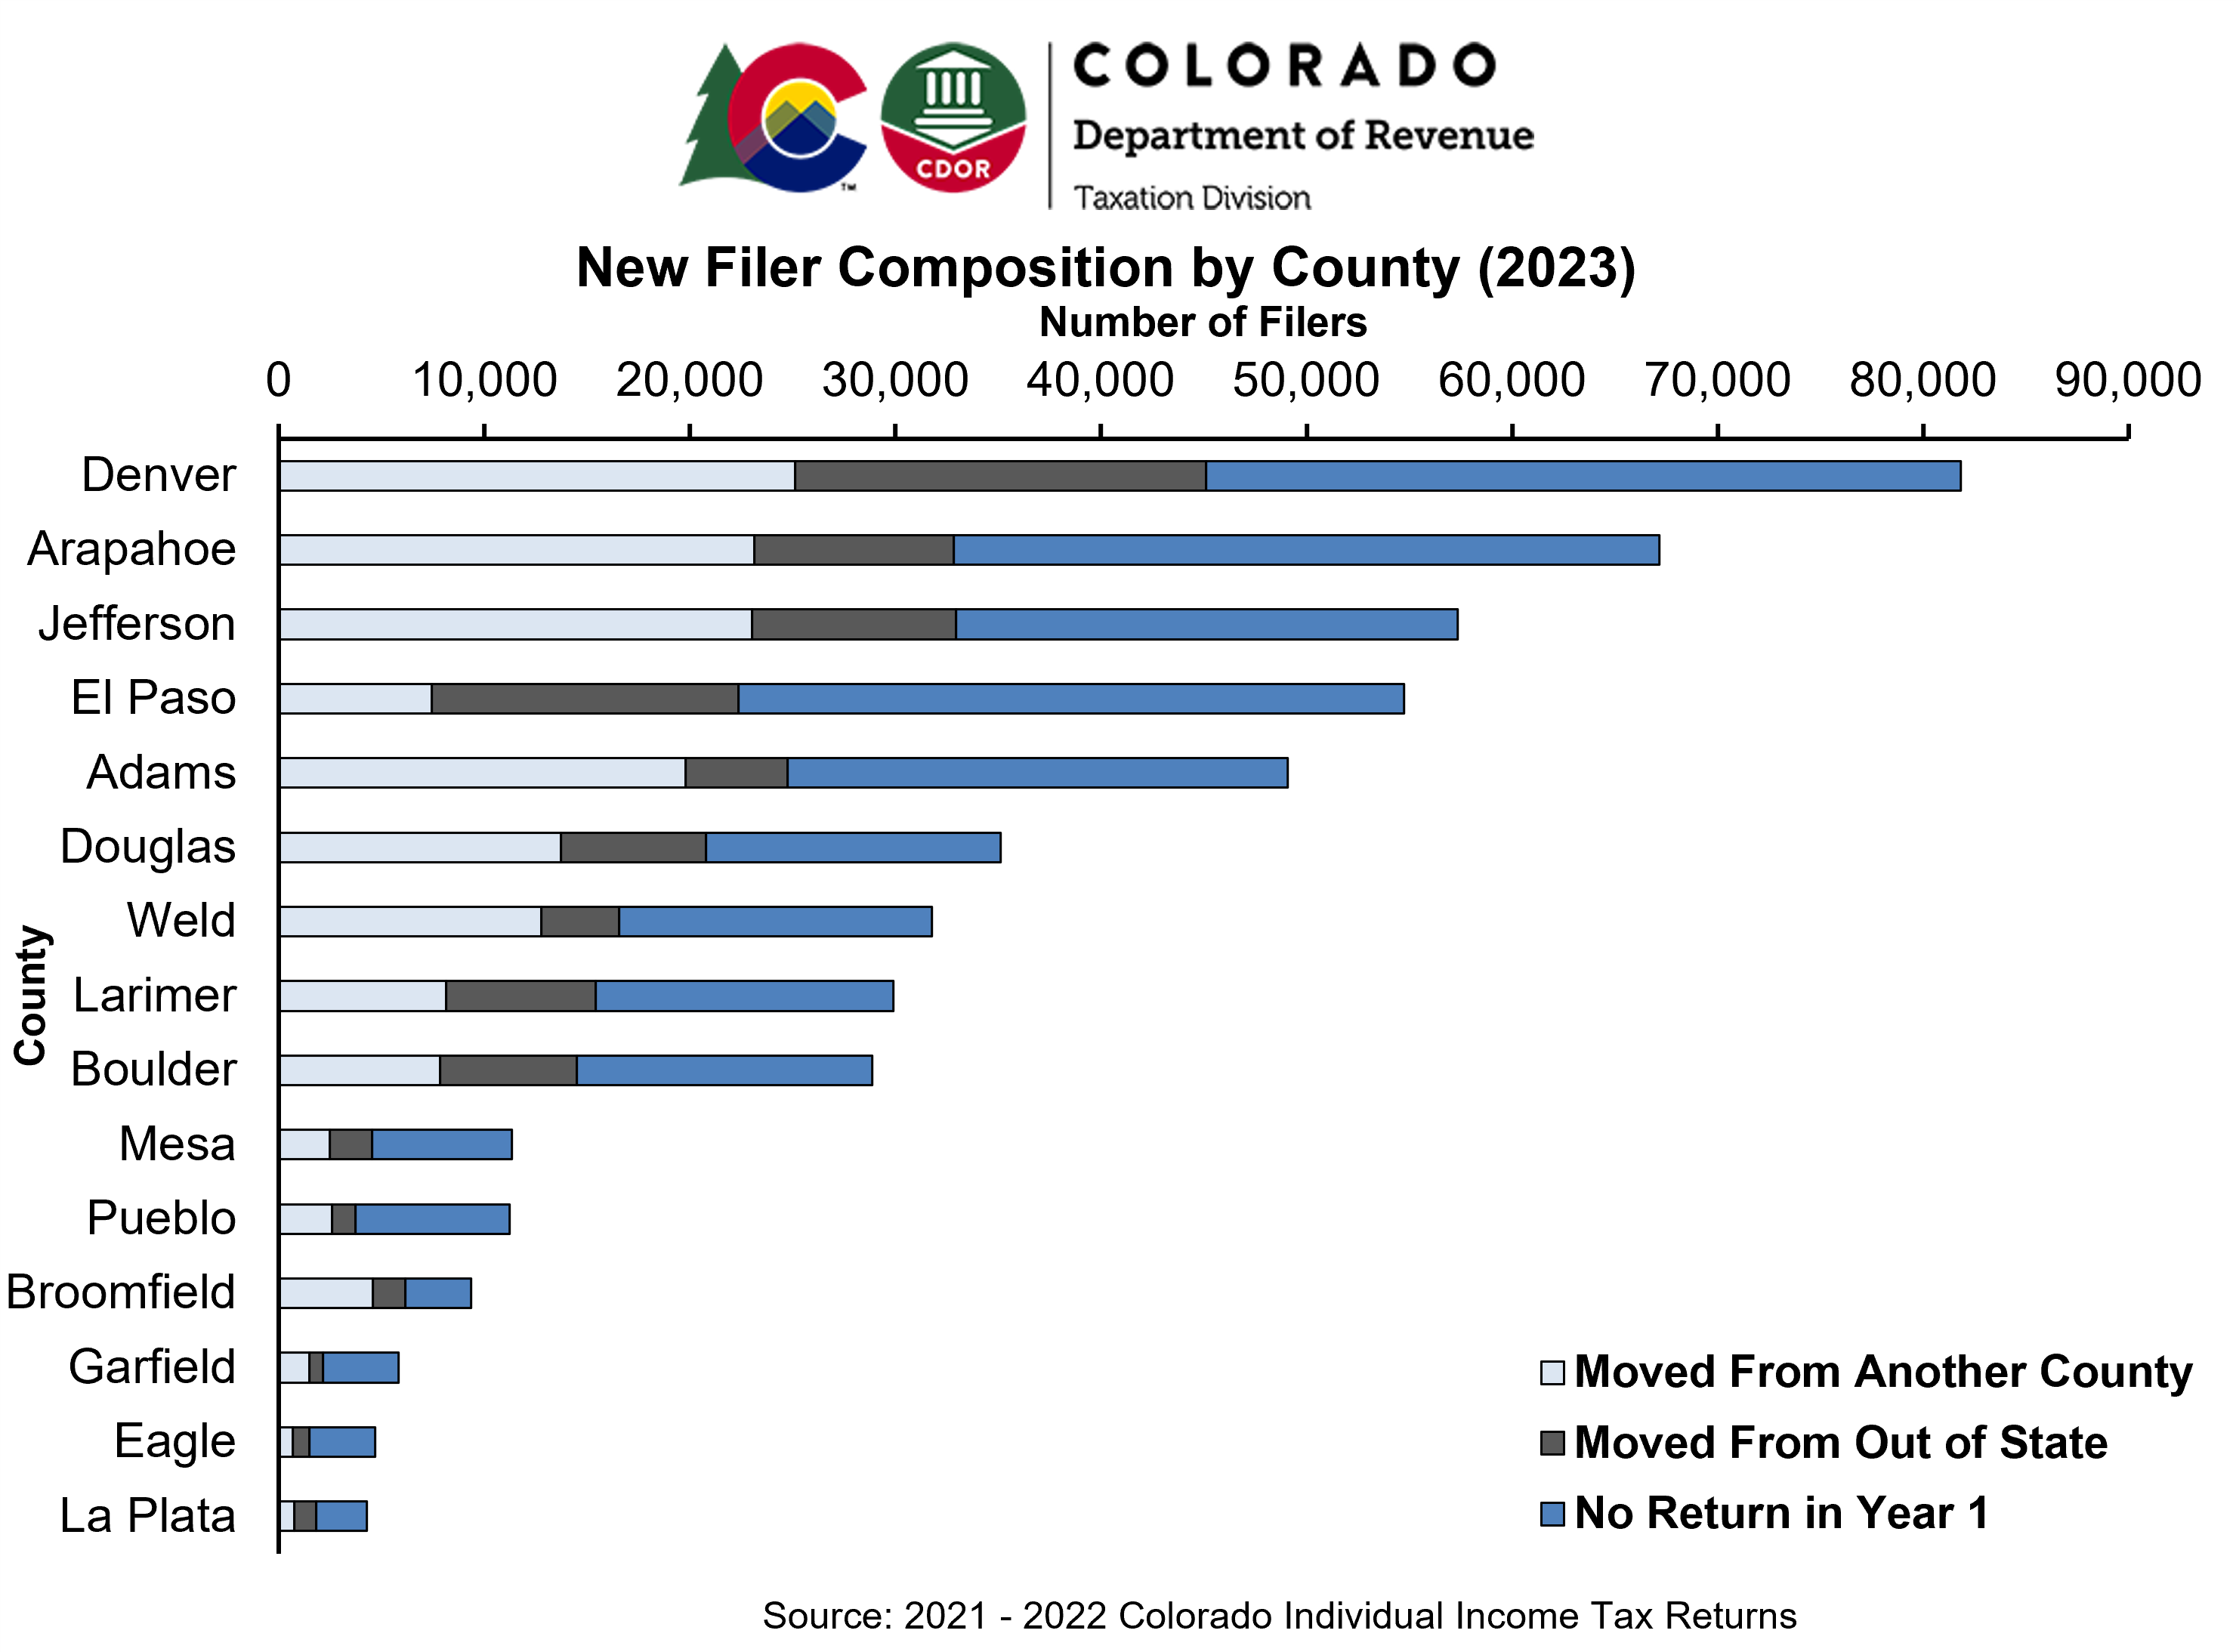
Migration Status by County
The migration status by county reports take a deeper look at three groups of filers at the county level: 1) filers who stayed in the counties for two consecutive years, 2) new filers in each county compared to the prior year, and 3) filers who left the counties. The reports summarize the average age, average income, and median income per migration group, as well as additional breakouts of the data by migration, such as the number of filers who moved to/from another county and moved to/from out of state.